

Scale Helicopter Survey 2026
 Michael K.
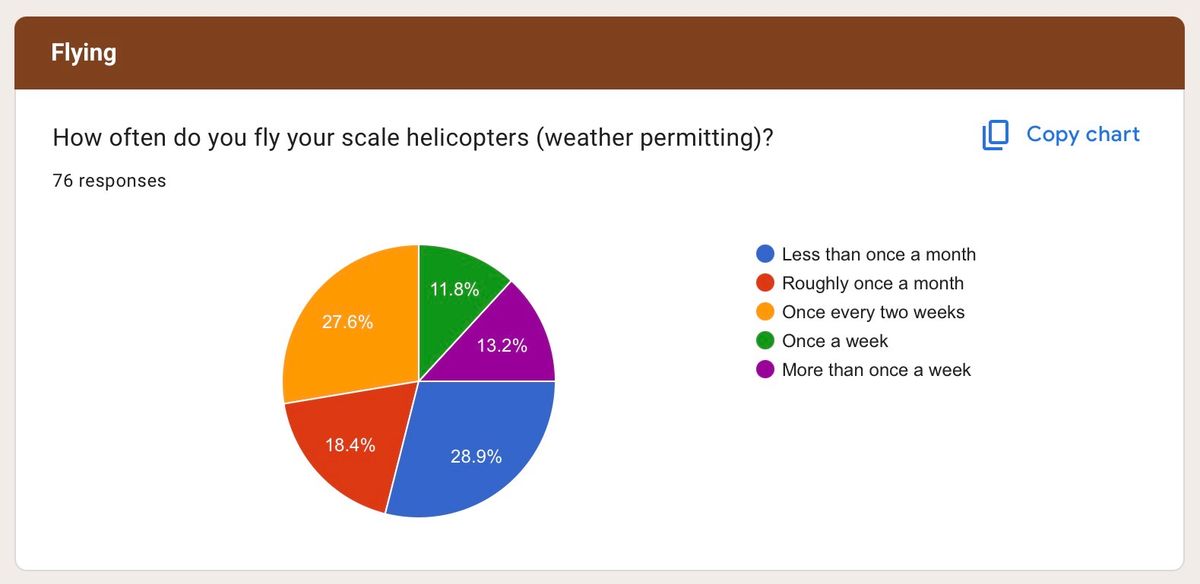
Executive Summary
A hearty thank-you to all who participated in the Scale Helicopter Survey. My aim in producing this was to understand the make-up and sentiment of our community, especially as it relates to events. Here's what we found:
1. The Experience & Investment Profile
* Veteran Community: The hobby is dominated by long-term pilots, with over 20% of respondents having started flying in the 1980s or earlier.
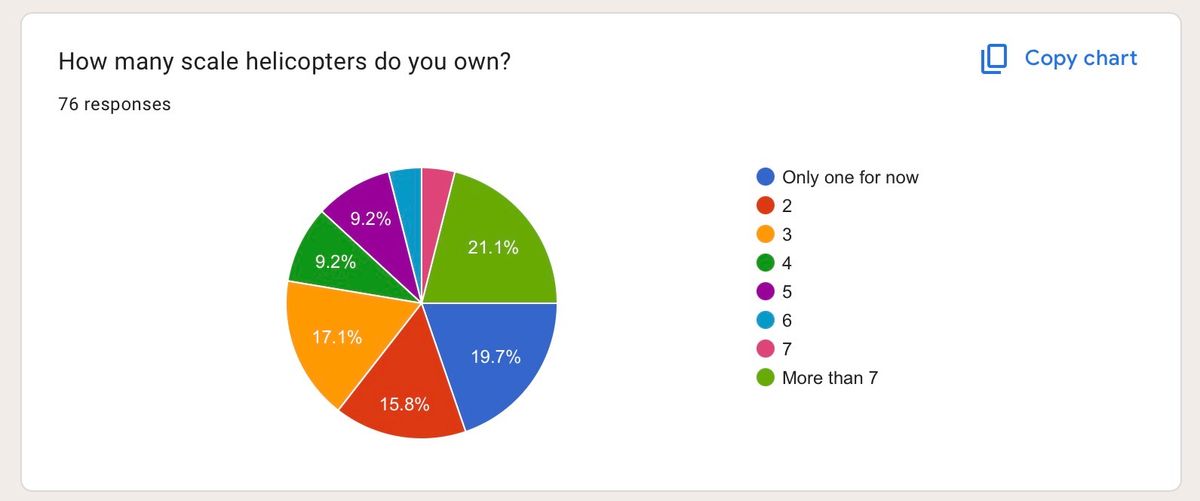
* Significant Investment: The "average" enthusiast is heavily committed; 29% of pilots own 6 or more scale helicopters, while another 20% own between 3 and 5.
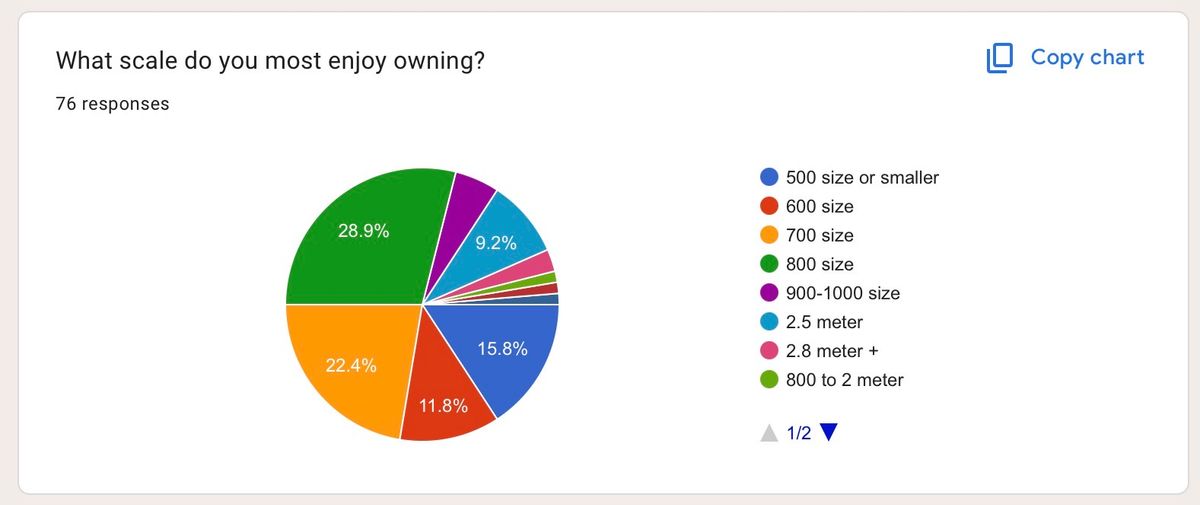
* Scale of Choice: There is a clear trend toward large-scale realism, with 700-size to 800-size models being the most enjoyed, while the most dedicated segment (approx. 10%) focuses on 2.5 meter+ giant scale.
2. The Flying Skills & Risk Paradox
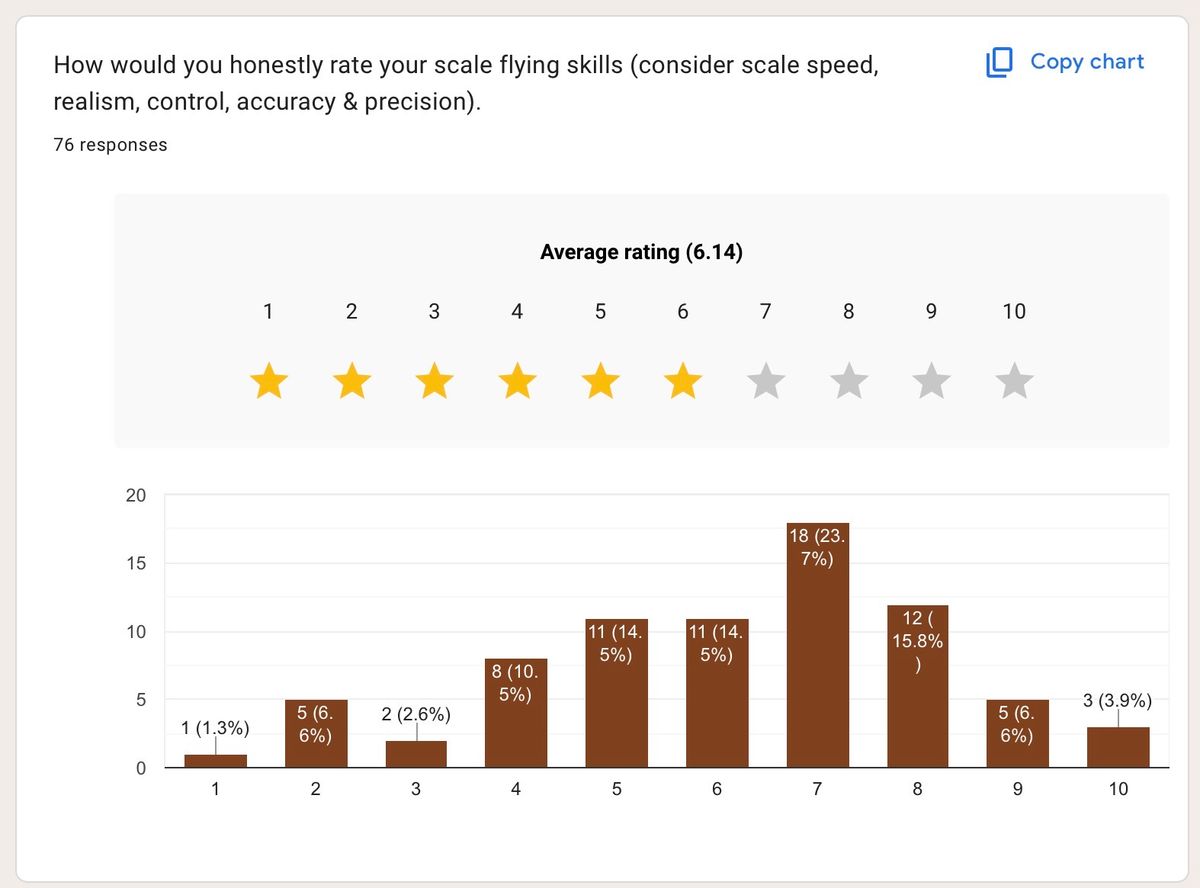
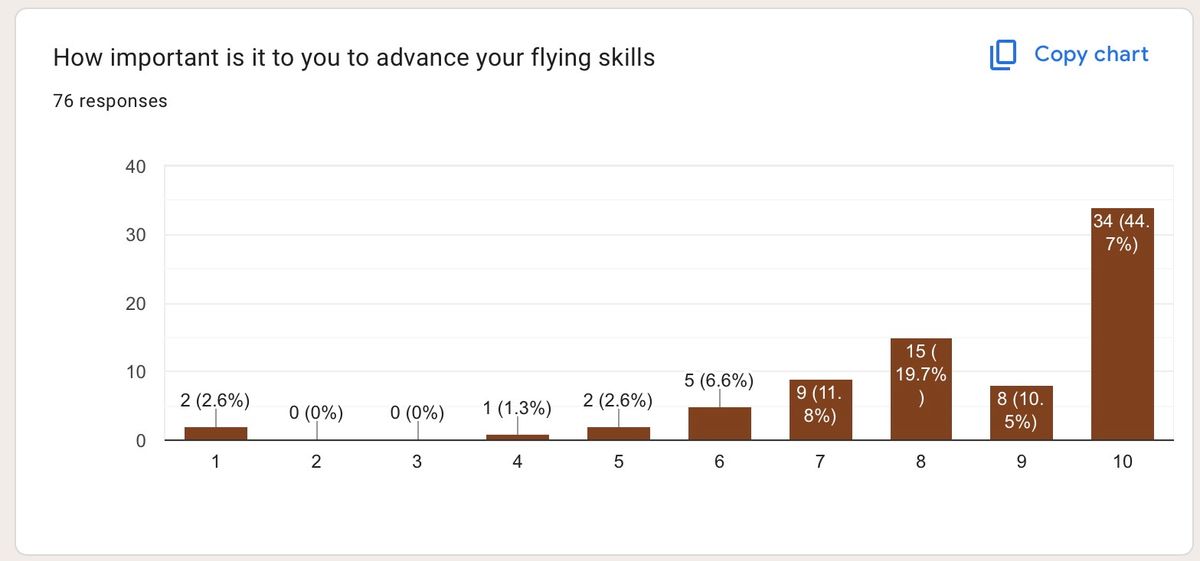
* Self-Perception vs. Practice: Pilots generally rate their skills high (averaging 7.2/10), yet they exhibit significant risk aversion.
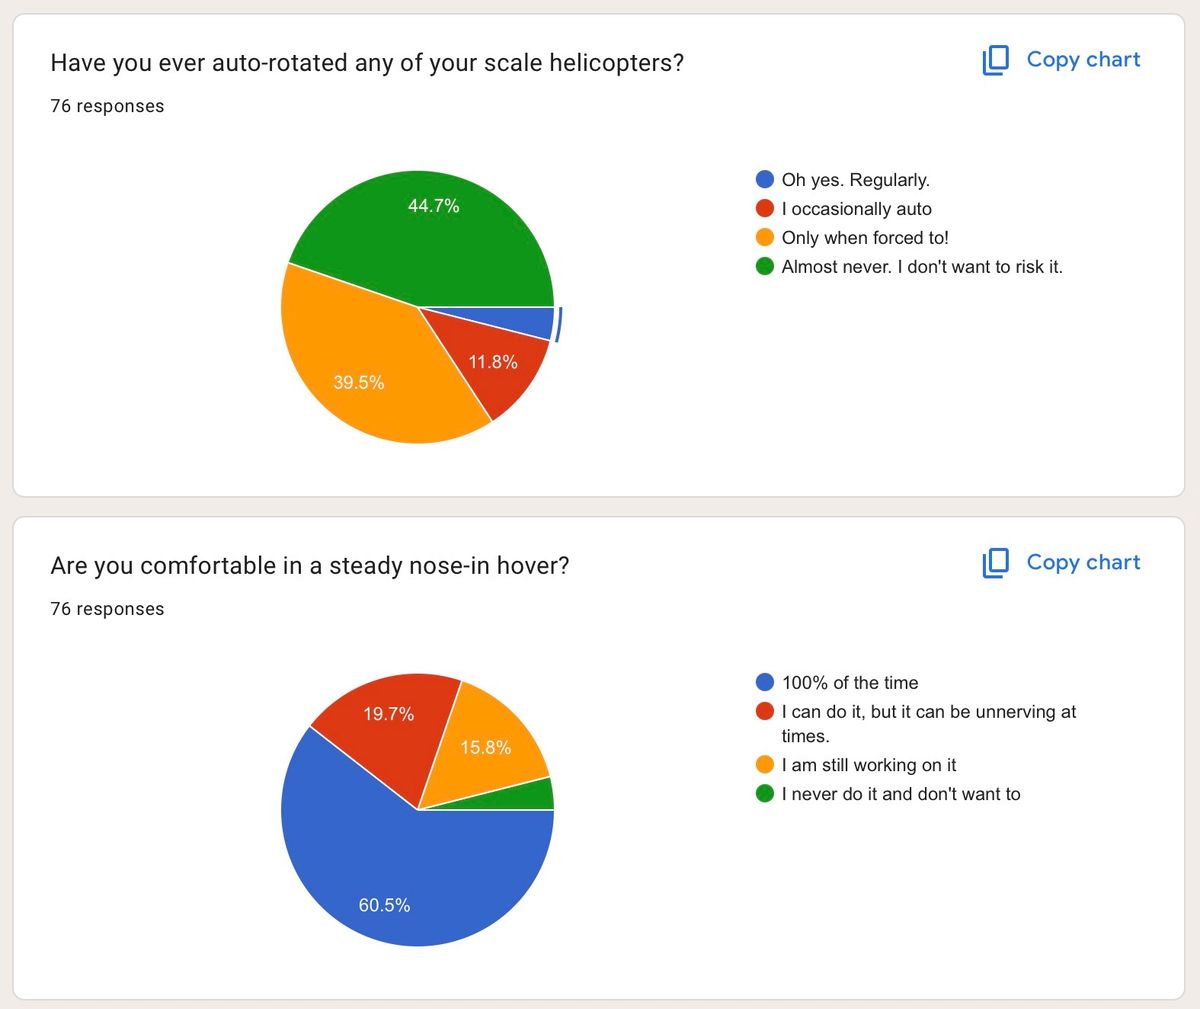
* Hover Confidence: Nearly 80% of pilots are comfortable in a nose-in hover 100% of the time.
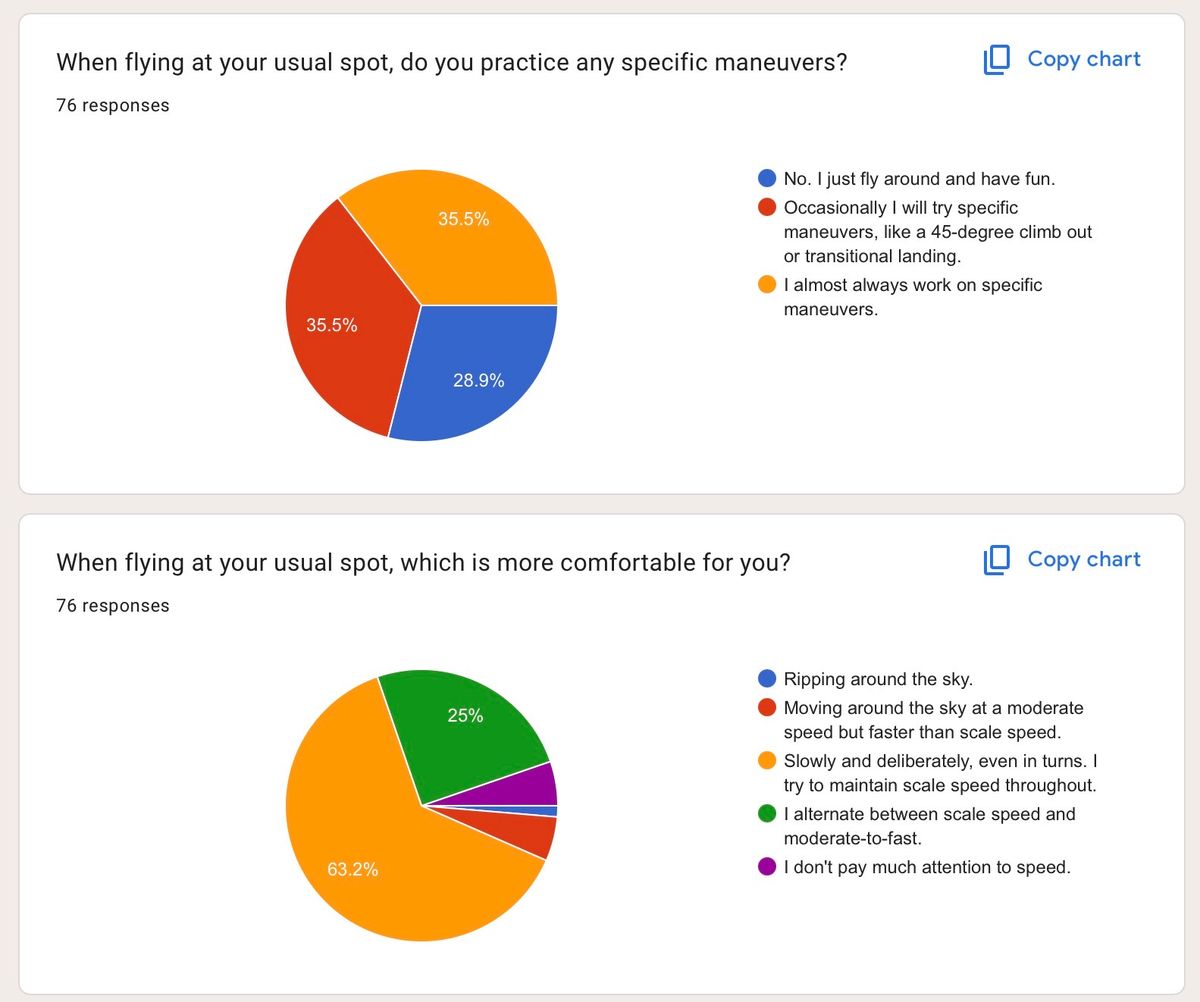
* The "Auto" Wall: Despite their experience, 85% of pilots will "almost never" or only auto-rotate "when forced to" save a model. This suggests the financial and emotional cost of a scale crash significantly outweighs the desire to practice high-risk maneuvers.
* Scale Realism: 72% of pilots intentionally fly "slowly and deliberately" to maintain scale realism, prioritizing the visual "show" over speed or technical aerobatics.
3. Building, Detailing, and the "Scale Whale"
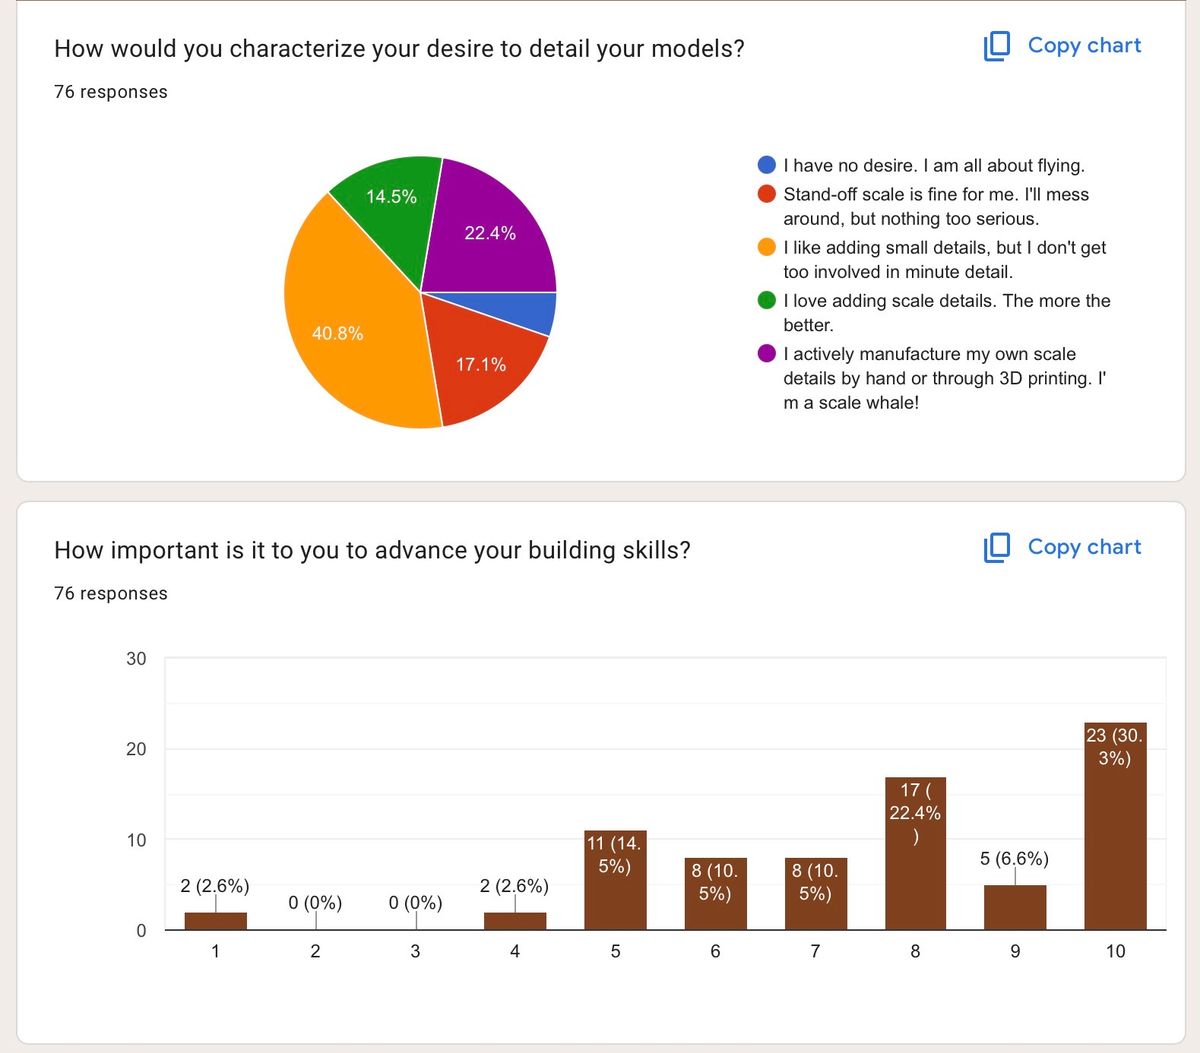
* Highly Skilled Detailing: A specialized group, self-identified as "Scale Whales" (22%), actively manufactures their own details via 3D printing or hand-crafting.
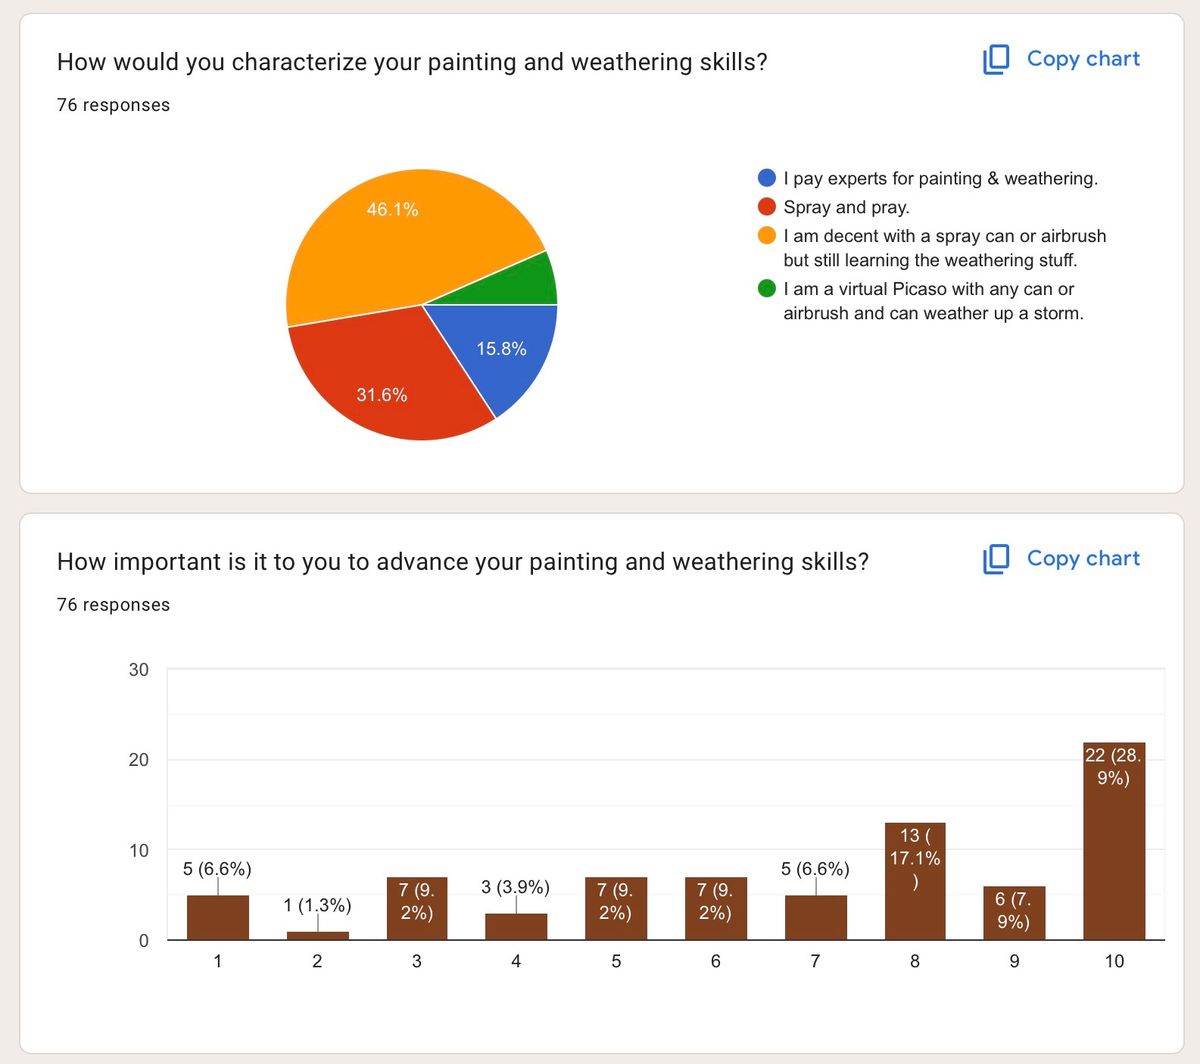
* The Learning Curve: Painting and weathering remain the biggest skill gaps; 65% of respondents describe their skills as either "spray and pray" or "still learning weathering," despite a high desire (averaging 8/10) to improve.
4. Event Attendance & Motivation
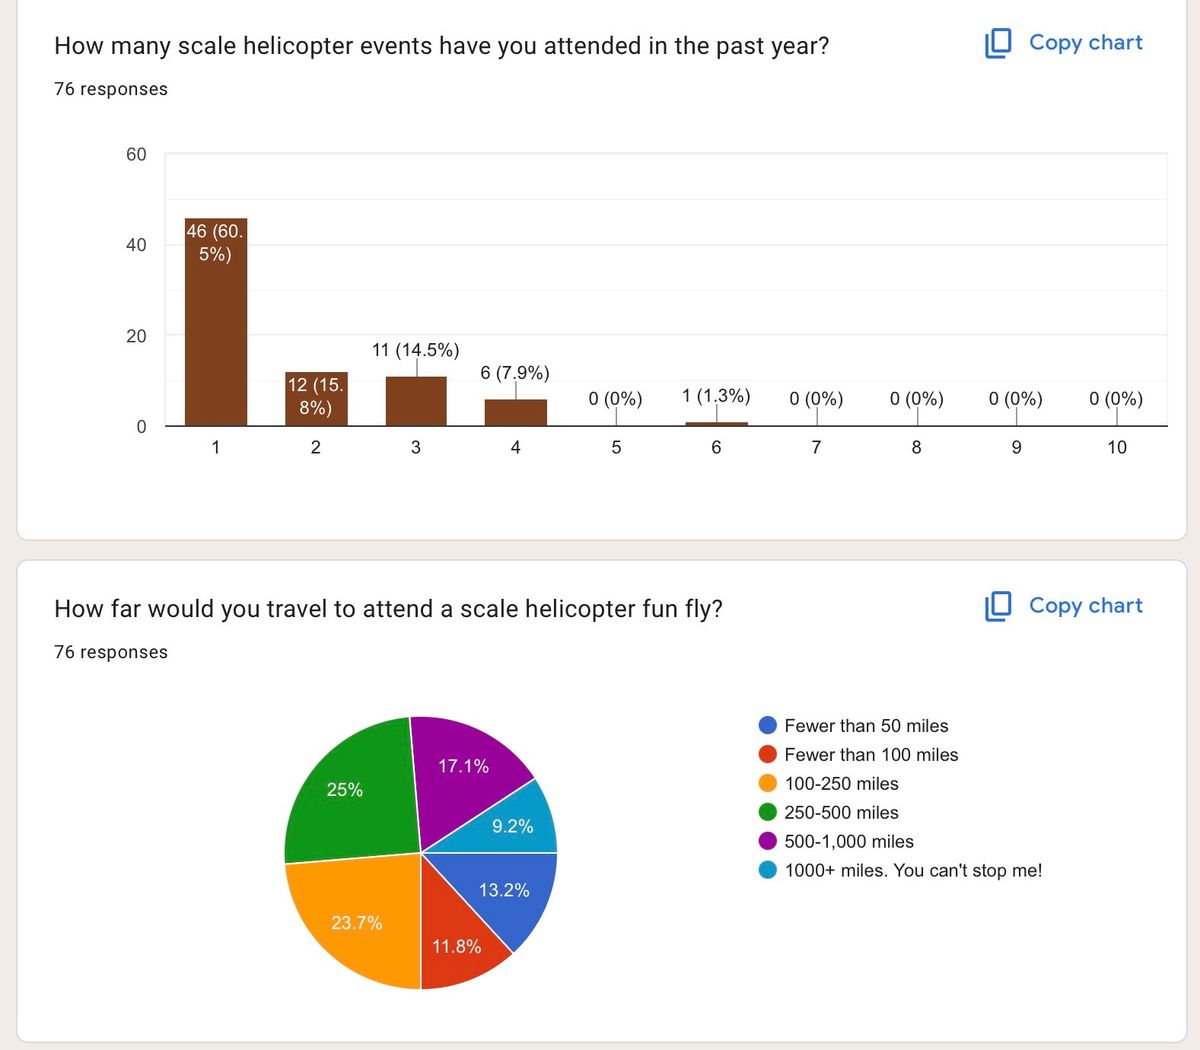
* Travel Commitment: Hobbyists are exceptionally mobile; 25% will travel over 500 miles, and 13% are willing to travel over 1,000 miles for a quality event.
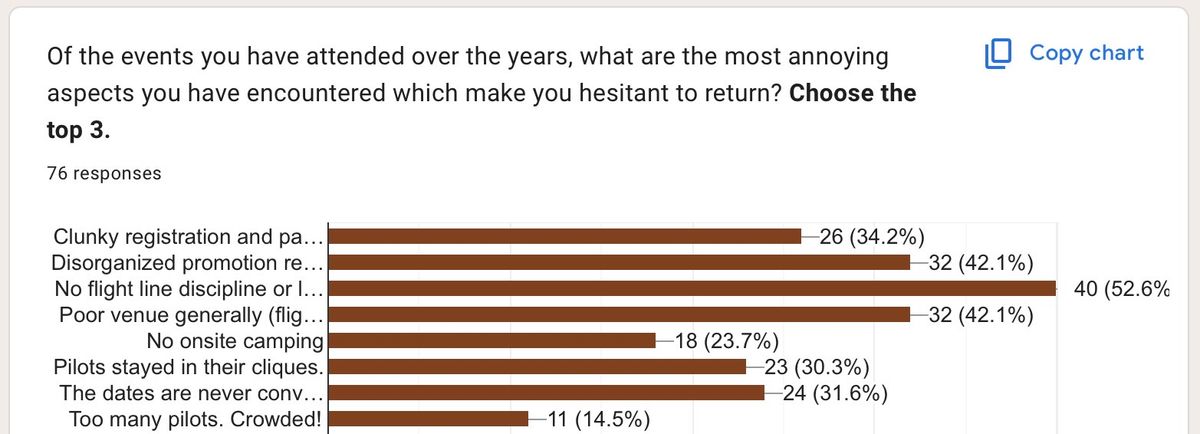
* Event Killers: The top reasons for not returning to an event are "No flight line discipline/safety enforcement" (53%) and "Disorganized promotion" (50%).
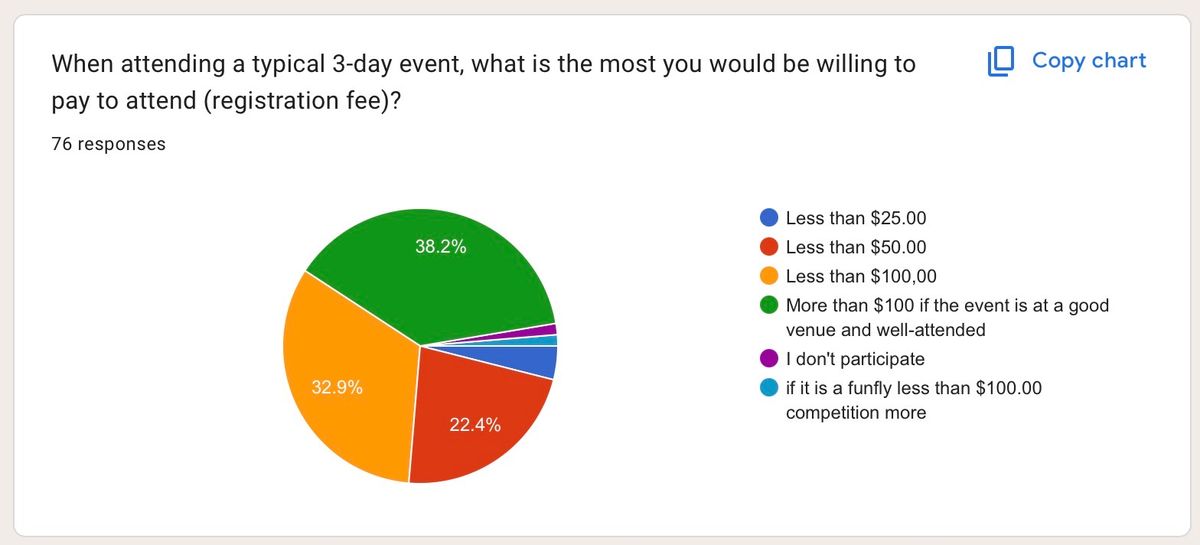
* Cost Sensitivity: Despite the high cost of the helicopters, 70% of pilots prefer registration fees to remain under $100 for a 3-day event.
5. The Competition Gap & Opportunity
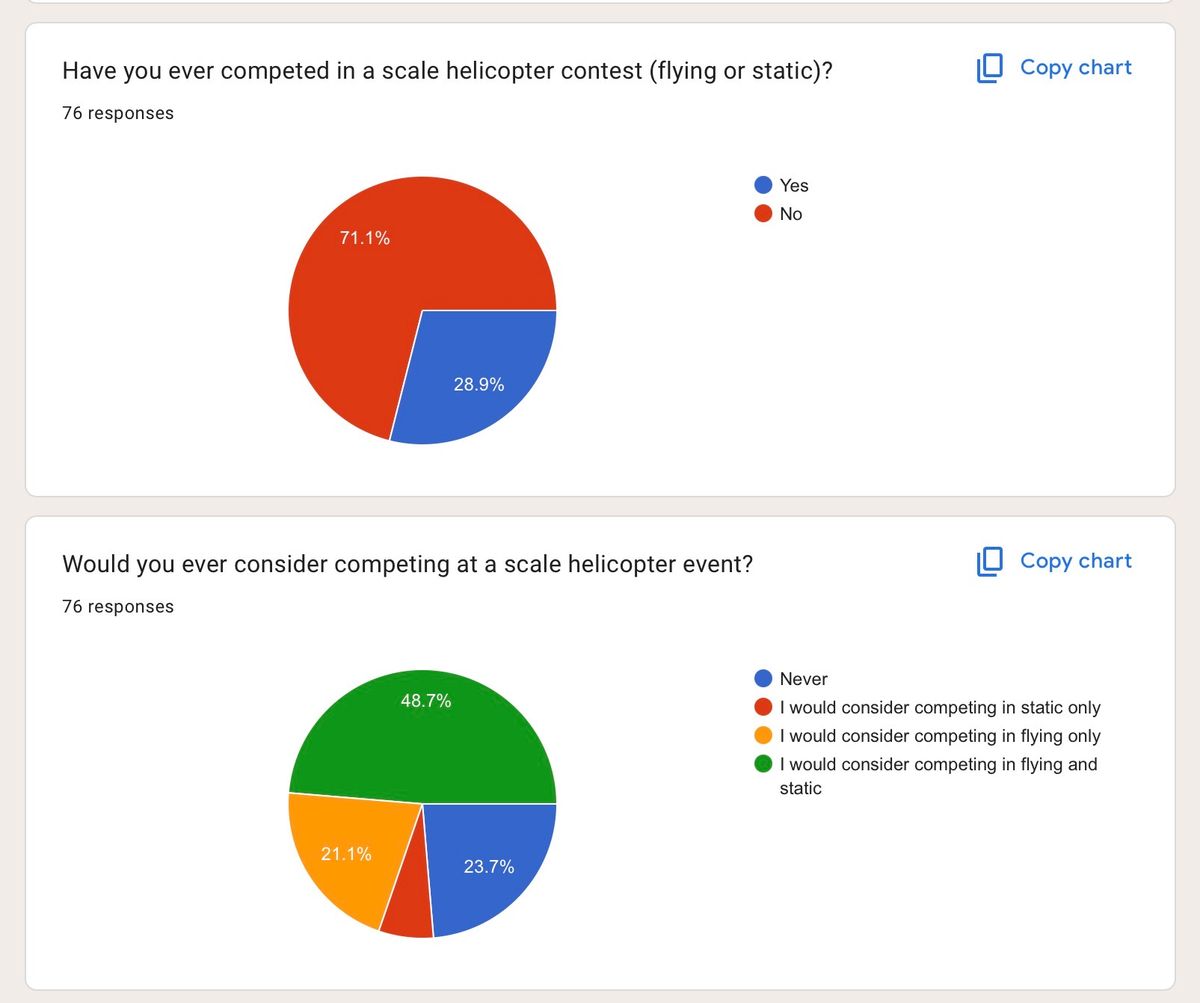
* Participation Gap: There is a massive disconnect between past participation and future interest. Only 29% of respondents have ever competed in a scale contest.
* Openness to Change: However, 75% of respondents are open to competing in the future (split between flying-only and flying+static).
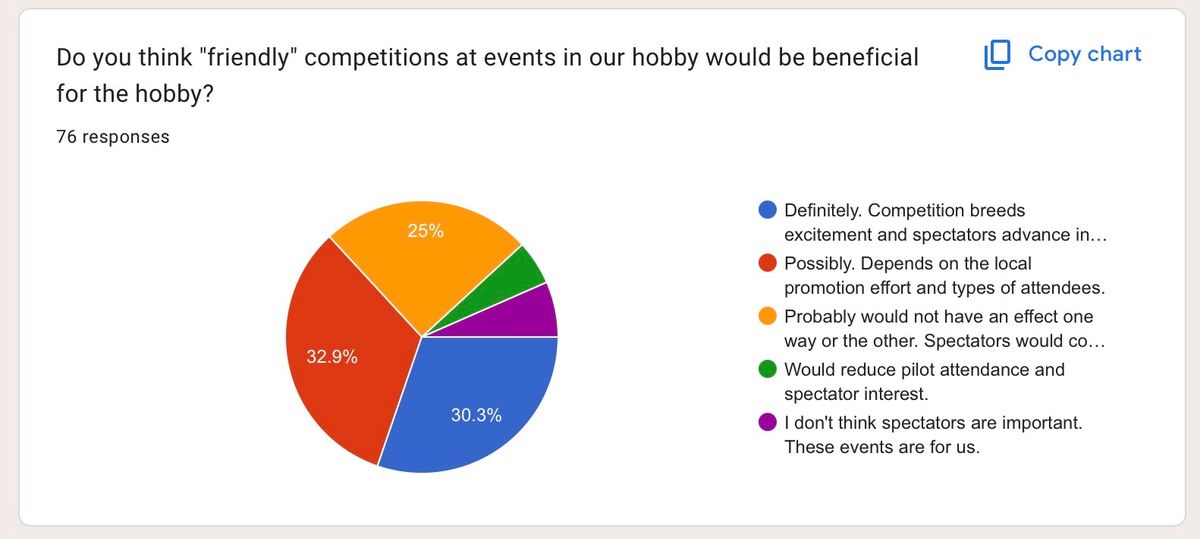
* Growth Potential: 84% believe that introducing "friendly" competitions would be beneficial or definitely beneficial to the hobby, citing that it "breeds excitement" and "advances interest" for spectators.
Analysis Summary
The data reveals what we already knew -- a hobby that is aging but highly invested, with a community that values professionalism and safety at events over low costs. Professionalism is a must with a discipline like ours, but given the amount of money we spend in this sector, price resistance at events (where so much is demanded of the event host) was surprising. The "Competition Gap" suggests that the current lack of competitive events isn't due to a lack of interest, but likely a lack of low-pressure, "friendly" formats that allow pilots to showcase their skills without the fear of the high-risk maneuvers they clearly avoid in their daily flying.
If you host an event or know someone who does, share this with them. I personally believe that competition makes everything more fun and inspires us to invest more time flying and building at levels that might stretch our capacity.
Selected Graphs - Demographics
Here are a few graphs from the study.
Selected Graphs - Flying
Here are charts on how pilots responded to flying questions.
Selected Graphs - Building
Here are some graphs showing how we feel about building:
Selected Graphs - Events
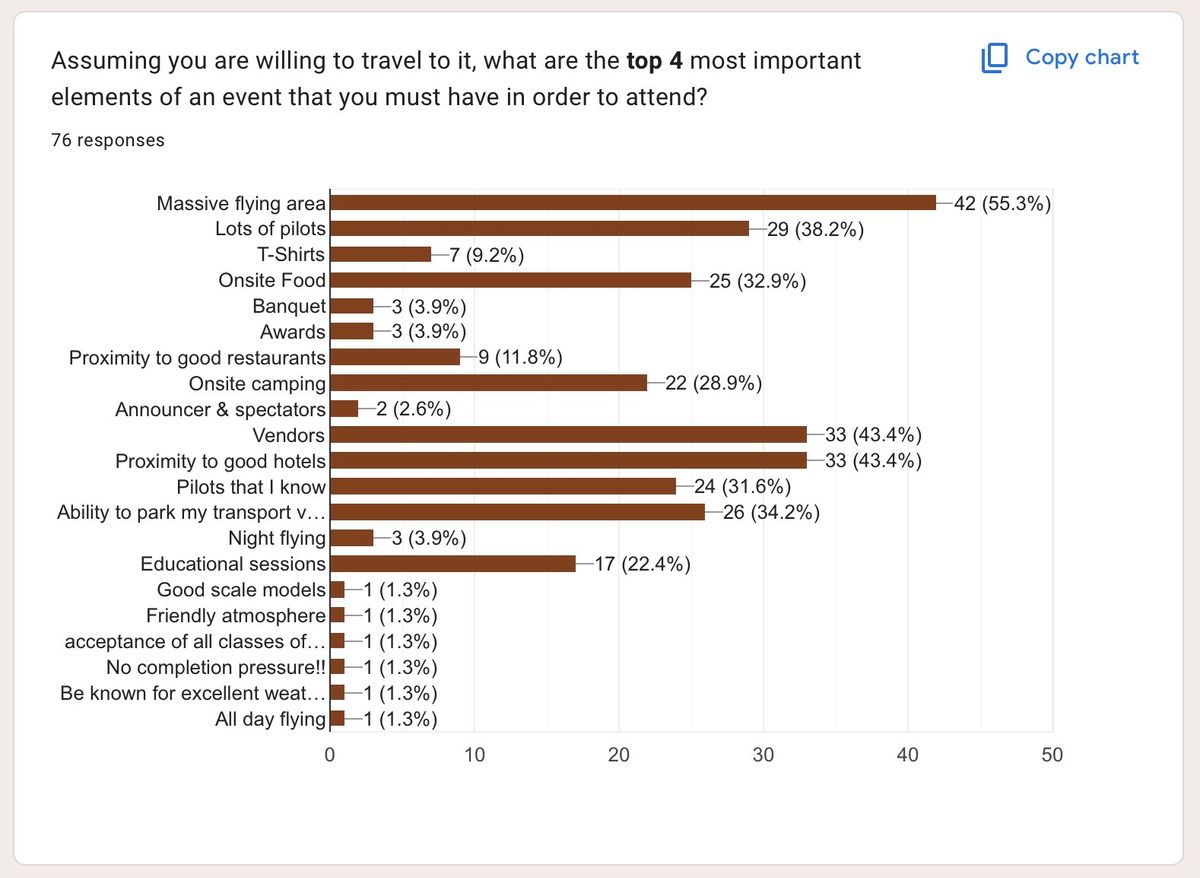
Here are charts showing how you feel about events:
3 Comments
I would say most are above average in supersonic scale speed and 8 turns. LLoLL
This is what I have been saying for years!!!!!!!! Thank you for the DATA
It's happening, man! More info to come.